Distance Learning and Remote Access
29 พฤษภาคม 2566
ผู้ชม 255 ผู้ชม
DESCRIPTION
Real time remote control of our equipment and simultaneous recording of data
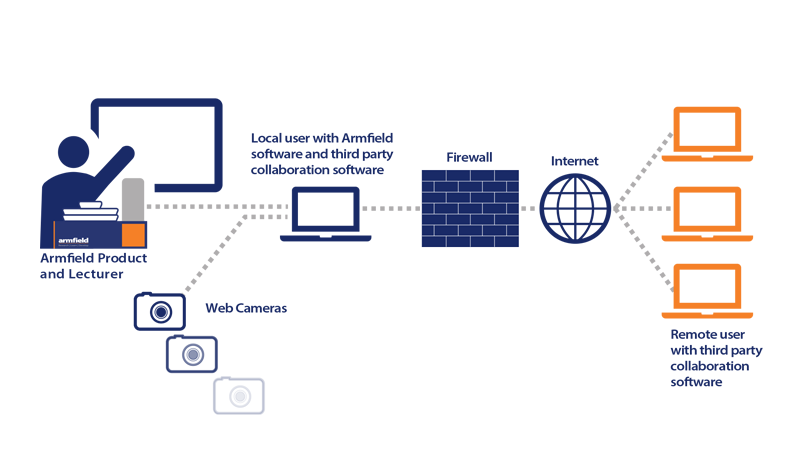
Our standard solution allows the student at a remote location to view the Armfield software and images from multiple webcam feeds produced via the collaboration software, as they would if they were present in the laboratory.
To future proof engineering teaching and research during the current global situation remote self-based learning has become mandatory. Engaging students in their subject is paramount and providing access to a user-based system that not only allows you real time data logging but also to remotely control equipment is a necessity in teaching going forward.
There are countless solutions available to migrate to a remote learning environment, enabling online classrooms to bring together virtual face-to-face contact, assignments, files, and conversations via a single platform. The value add in the Armfield solution is to enable the student to truly conduct their studies and research remotely. We not only extend the classroom but also the laboratory environment by providing solutions that enable remote control of the equipment variables.
DEMONSTRATION CAPABILITIES
-
Actual details are exercise specific, but typically the following features are available:
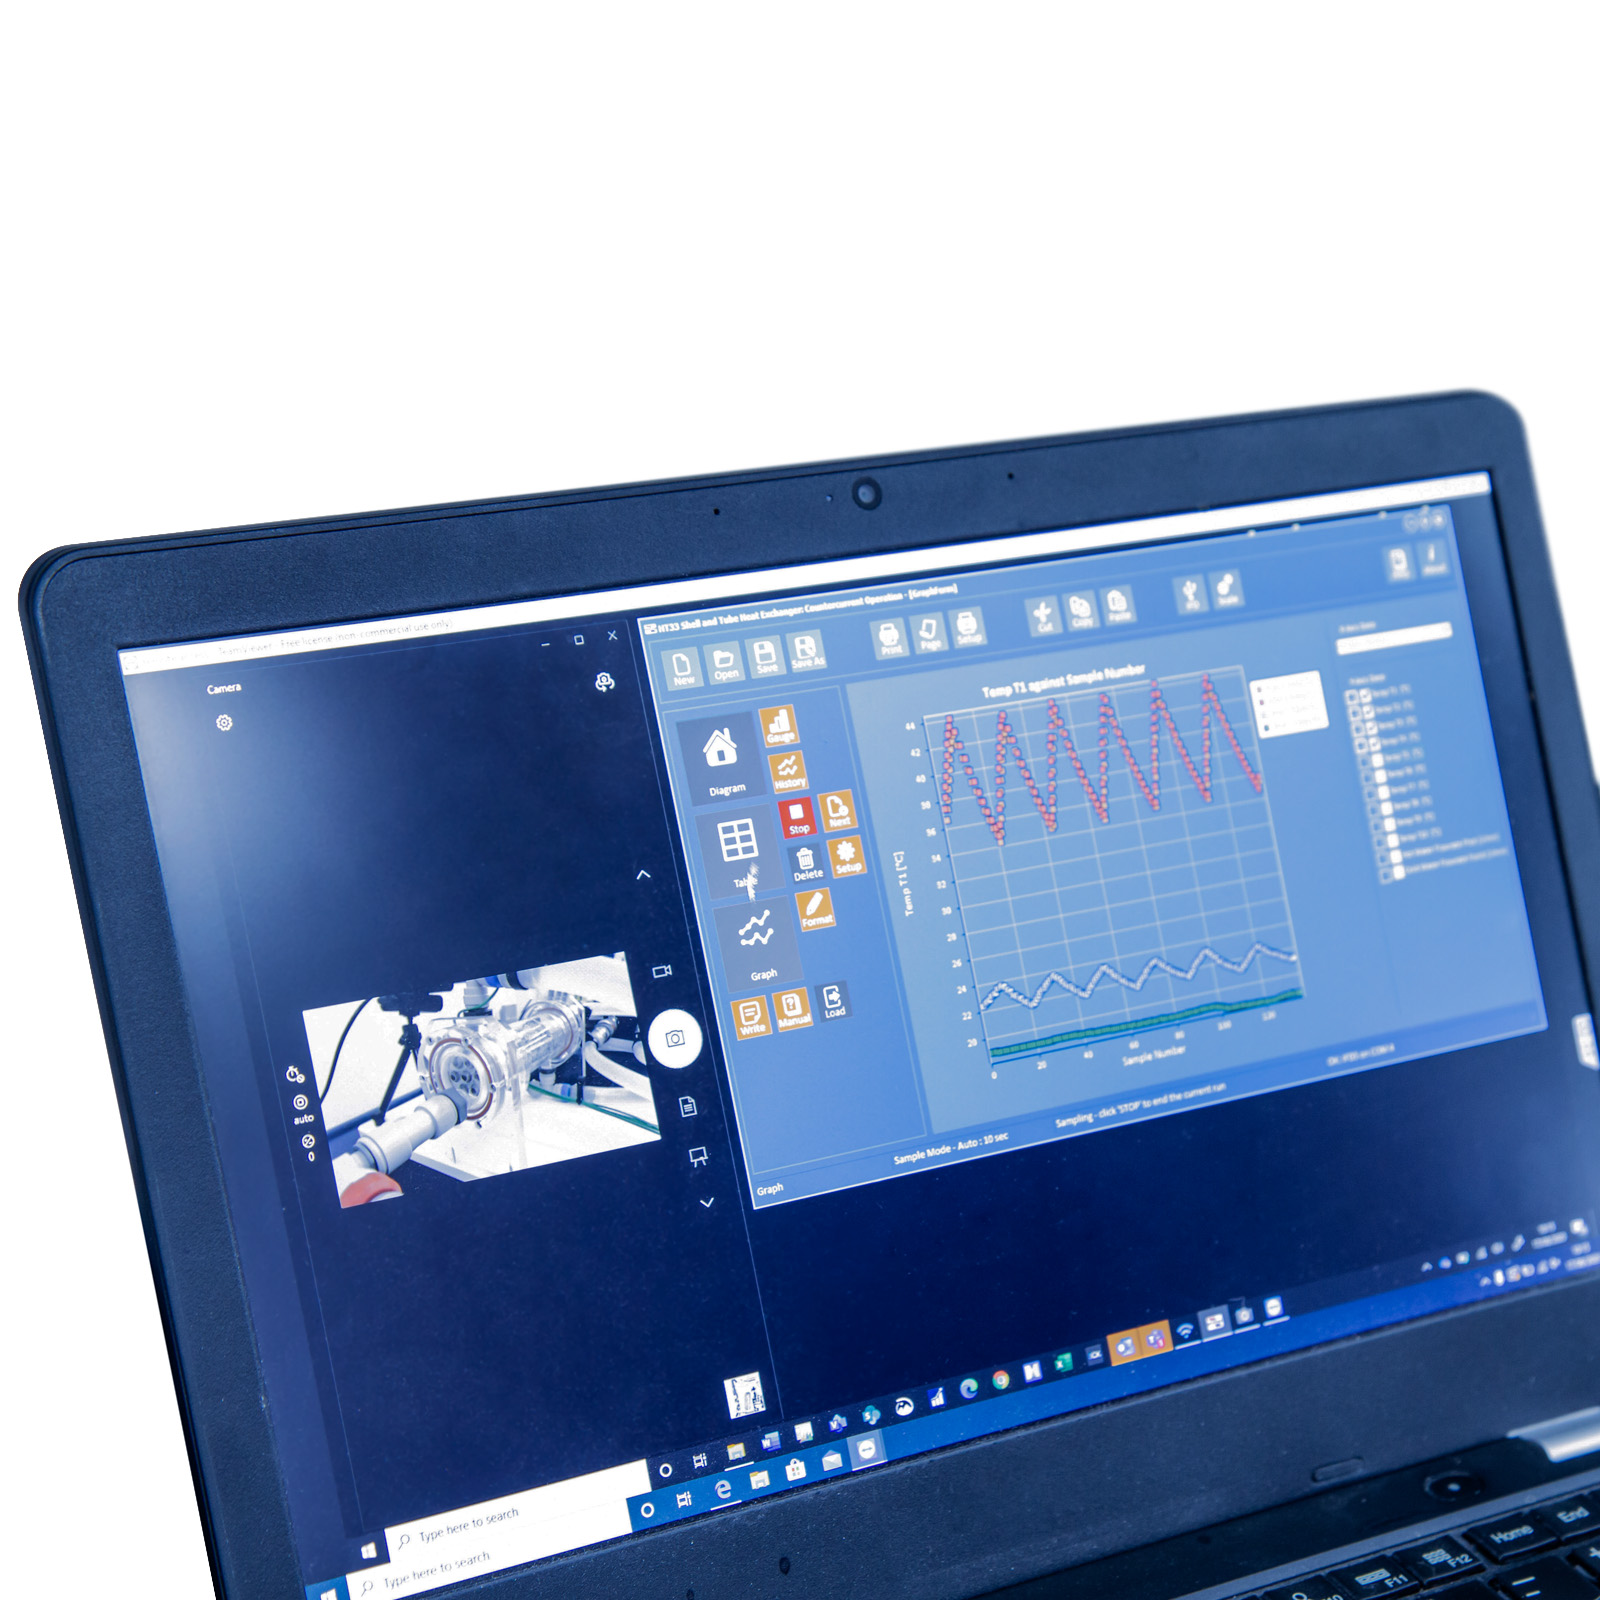
- All the temperatures and flow rates are displayed on a diagrammatic representation of the equipment
- Water flow / temperature is PID controlled, can be remote controlled
- Data from the sensors is logged into a spreadsheet format, under operator control
- Sophisticated graph plotting facilities are provided.
- Comparisons between data taken on different runs can be displayed
- Student questions and answers, including a layered “Hint” facility
- Processing of measured values to obtain calculated results (this can be linked to the questions and answers to ensure student understanding)
- The data samples (measured and calculated) can be saved, or exported directly in Microsoft Excel format.
- Data from the sensors can be displayed independently from the data logging. This can be in bar graph format, or a recent history
- Graphical display (useful to check for temperature stability prior to taking a sample)
- Presentation screens are available, giving an overview of the software, the equipment, the procedure and the associated theory
- This is backed up by a detailed “Help” facility giving in-depth guidance and background information
