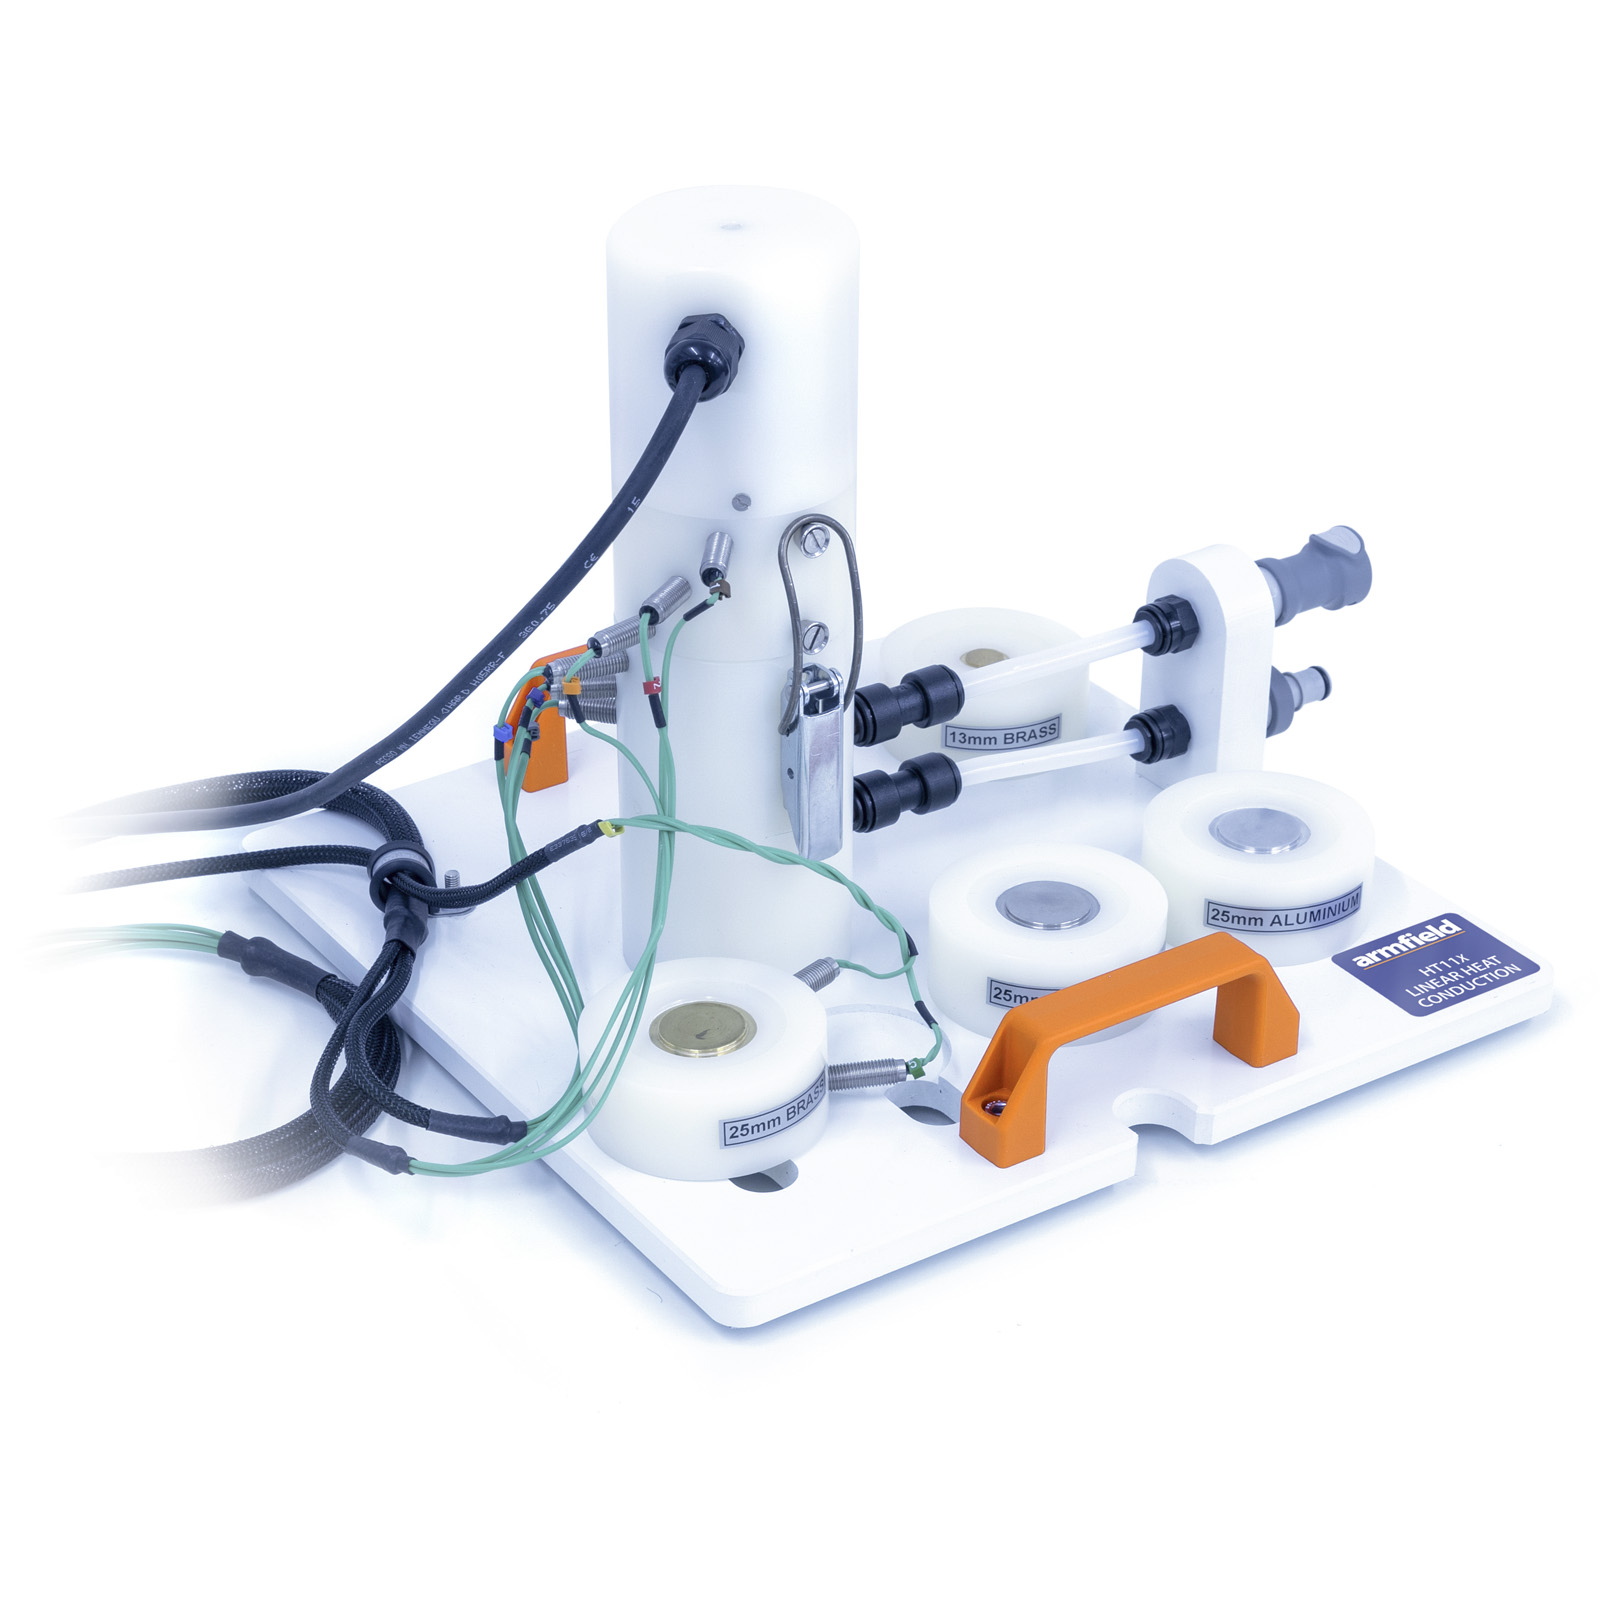
Linear Heat Conduction
20 เมษายน 2566
ผู้ชม 502 ผู้ชม
DESCRIPTION
The accessory comprises a heating section and a cooling section, which can be clamped together or clamped with interchangeable intermediate sections between them, as required. The temperature difference created by the application of heat to one end of the resulting wall and cooling at the other end results in the flow of heat linearly through the wall by conduction.
- Thermocouples are positioned along both the heated section and cooled section at uniform intervals of 15mm to measure the temperature gradient along the sections
- Heater can be voltage or PID controlled allowing for the temperature set-point to be achieved rapidly and maintained within 0.1°C
- The HT10X service unit provides the accessory with the cooling water system
- A pressure regulator is incorporated to minimise the effect of fluctuations in the supply pressure
- The cooling water flow rate is measured by a turbine type flow sensor
- A control valve on the HT10X service unit allows the flow of cooling water to be varied, if required, over the operating range of 0-1.5 l/min. Valve can be PID controlled for improved supply pressure disturbance reduction
Four intermediate sections are supplied as follows:
- 30mm-long brass section of the same diameter as the heating and cooling sections are fitted with two thermocouples at the same intervals. When this section is clamped between the heating and cooling sections, a long plane wall of uniform material and cross-section is created with temperatures measured at eight positions
- Stainless-steel section of the same dimensions as the brass section to demonstrate the effect of change in thermal conductivity
- Aluminium section of the same dimensions as the brass section to demonstrate the effect of change in thermal conductivity 30mm-long brass section reduced in diameter to 13mm to demonstrate the effect of change in cross-sectional area
- The heat-conducting properties of insulators may be found by simply inserting the paper or cork specimens supplied between the heating and cooling sections
- A tube of thermal paste is provided to demonstrate the difference between good and poor thermal contact between the sections
EXPERIMENTAL CAPABILITIES
- Understanding the use of the Fourier rate equation in determining rate of heat flow through solid materials
- Measuring the temperature distribution for steady-state conduction of energy through a uniform plane wall and a composite plane wall
- Overall heat transfer coefficient for differing materials in series
- Determining the constant of proportionality (thermal conductivity k) of different materials (conductors and insulators)
- Relationship of temperature gradient to cross-sectional area
- Effect of contact resistance on thermal conduction
- Understanding the application of poor conductors (insulators)
- Observing unsteady-state conduction (qualitative only)
TECHNICAL SPECIFICATIONS
A small-scale accessory to introduce students to the principles of linear heat conduction, and to enable the conductivity of various solid conductors and insulators to be measured.
- Comprises a PID controlled heating section and cooling section, plus four intermediate section conductor samples and two insulator samples
- The heating section, cooling section and one of the intermediate sections are fitted with thermocouples (eight in total) evenly spread along the length of the assembled conduction path
- All sections are thermally insulated to minimise errors due to heat loss
- Heater power variable up to 60W
- Water flow rate variable up to 1.5 l/min
- Heating and cooling sections, 25mm diameter
- A comprehensive instruction manual is included
FEATURES & BENEFITS
A full armBus educational software suite is provided with the HT10X for all the Armfield heat transfer accessories.
Individual experiment interfaces and displayed data types vary to match selected experiment accessories, common examples are listed below:
- Temperatures and other signals such as flow rates, heater voltage and current are displayed on a diagrammatic representation of the equipment
- Control outputs are operated by a control slider or typing in a value between 0 and 100%. Sensor values are read directly in engineering units
- PID automatic control option is available, permitting the temperature set-point to be achieved quickly and precisely, coping with disturbance rejection
- A maintenance screen allows for PID parameter adjustment and thermocouple calibration
- Data from the sensors are logged into a spreadsheet format, with operator control over the sampling intervals (or ‘single-shot’)
- Sophisticated graph-plotting facilities are provided, including plotting of both measured and calculated values
- Graphs update in real-time as the samples are being taken
- Processing of measured values to obtain calculated values is linked to the questions and answers to ensure student understanding
- Experiment data samples are saved, or exported in Microsoft Excel format
- Real-time sensor data is displayed independently from the data logging. It is possible to check the recent history graphical display to inspect the temperature stability prior to taking a sample


